
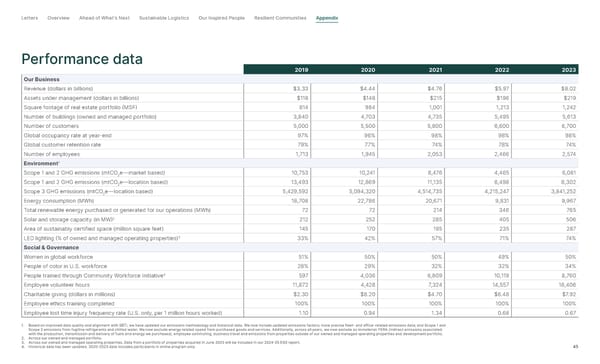
Letter s Overview Ahead of What’s Next Sustainable Logistics Our Inspired People Resilient Communities Appendix Performance data 2019 2020 2021 2022 2023 Our Business Revenue (dollars in billions) $3.33 $4.44 $4.76 $5.97 $8.02 Assets under management (dollars in billions) $118 $148 $215 $196 $219 Square footage of real estate portfolio (MSF) 814 984 1,001 1,213 1,242 Number of buildings (owned and managed portfolio) 3,840 4,703 4,735 5,495 5,613 Number of customers 5,000 5,500 5,800 6,600 6,700 Global occupancy rate at year-end 97% 96% 98% 98% 98% Global customer retention rate 79% 77% 74% 78% 74% Number of employees 1,713 1,945 2,053 2,466 2, 5 74 Environment 1 Scope 1 and 2 GHG emissions (mtCO 2 e—market based) 10,753 10,241 8,476 4,465 6,081 Scope 1 and 2 GHG emissions (mtCO 2 e—location based) 13,493 12,869 11,135 6,498 8,302 Scope 3 GHG emissions (mtCO 2 e—location based) 5,429,592 5,094,320 4,514,735 4,215,247 3,841,252 Energy consumption (MWh) 18,708 22,786 20,671 9,831 9,967 Total renewable energy purchased or generated for our operations (MWh) 72 72 214 346 765 Solar and storage capacity (in MW) 2 212 252 285 405 506 Area of sustainably certified space (million square feet) 145 170 195 235 287 LED lighting (% of owned and managed operating properties) 3 33% 42% 57% 71% 74% Social & Governance Women in global workforce 51% 50% 50% 49% 50% People of color in U.S. workforce 28% 29% 32% 32% 34% People trained through Community Workforce Initiative 4 597 4,036 6,809 10,119 8,760 Employee volunteer hours 11,872 4,428 7, 3 2 4 14,557 16,406 Charitable giving (dollars in millions) $2.30 $8.20 $4.70 $6.48 $ 7. 9 2 Employee ethics training completed 100% 100% 100% 100% 100% Employee lost time injury frequency rate (U.S. only, per 1 million hours worked) 1.10 0.94 1.34 0.68 0.67 1. Based on improved data quality and alignment with SBTi, we have updated our emissions methodology and historical data. We now include updated emissions factors; more precise fleet- and office-related emissions data; and Scope 1 and Scope 2 emissions from fugitive refrigerants and chilled water. We now exclude energy related spend from purchased goods and services. Additionally, across all years, we now exclude as immaterial: FERA (indirect emissions associated with the production, transmission and delivery of fuels and energy we purchased), employee commuting, business travel and emissions from properties outside of our owned and managed operating properties and development portfolio. 2. Across our owned and managed portfolio. 3. Across our owned and managed operating properties. Data from a portfolio of properties acquired in June 2023 will be included in our 2024-25 ESG report. 4. Historical data has been updated. 2020-2023 data includes participants in online program only. 45
 2023-24 ESG Report Page 44 Page 46