
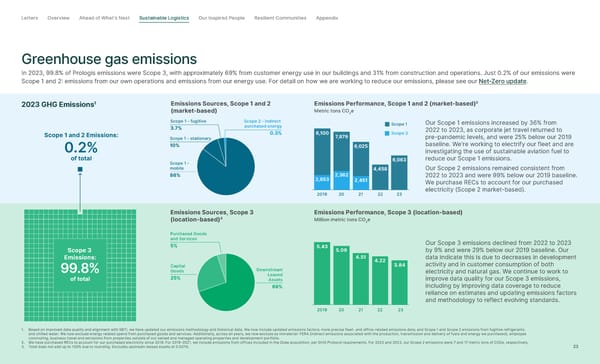
Letter s Overview Ahead of What’s Next Sustainable Logistics Our Inspired People Resilient Communities Appendix Greenhouse gas emissions In 2023, 99.8% of Prologis emissions were Scope 3, with approximately 69% from customer energy use in our buildings and 31% from construction and operations. Just 0.2% of our emissions were Scope 1 and 2: emissions from our own operations and emissions from our energy use. For detail on how we are working to reduce our emissions, please see our Net-Zero update . 2023 GHG Emissions 1 Emissions Sources, Scope 1 and 2 Emissions Performance, Scope 1 and 2 (market-based) (market-based) Metric tons CO 2 e Scope 1 – fugitive Scope 2 – indirect Scope 1 Our Scope 1 emissions increased by 36% from 3.7% purchased energy 2022 to 2023, as corporate jet travel returned to Scope 1 and 2 Emissions: 0.3% 8,100 7, 8 7 9 Scope 2 pre-pandemic levels, and were 25% below our 2019 Scope 1 – stationary baseline. We're working to electrify our fleet and are 0.2% 10% 6,025 investigating the use of sustainable aviation fuel to of total 6,063 reduce our Scope 1 emissions. Scope 1 – mobile 4,458 Our Scope 2 emissions remained consistent from 86% 2,653 2,362 2022 to 2023 and were 99% below our 2019 baseline. 2,451 We purchase RECs to account for our purchased 2019 20 21 22 23 electricity (Scope 2 market-based). Emissions Sources, Scope 3 Emissions Performance, Scope 3 (location-based) (location-based) Million metric tons CO 2 e Purchased Goods and Services Our Scope 3 emissions declined from 2022 to 2023 Scope 3 5% 5.43 5.09 by 9% and were 29% below our 2019 baseline. Our Emissions: 4.51 4.22 data indicate this is due to decreases in development Capital 3.84 activity and in customer consumption of both 99.8% Goods Downstream electricity and natural gas. We continue to work to of total 25% Leased improve data quality for our Scope 3 emissions, Assets 69% including by improving data coverage to reduce reliance on estimates and updating emissions factors and methodology to reflect evolving standards. 2019 20 21 22 23 1. Based on improved data quality and alignment with SBTi, we have updated our emissions methodology and historical data. We now include updated emissions factors; more precise fleet- and office-related emissions data; and Scope 1 and Scope 2 emissions from fugitive refrigerants and chilled water. We now exclude energy related spend from purchased goods and services. Additionally, across all years, we now exclude as immaterial: FERA (indirect emissions associated with the production, transmission and delivery of fuels and energy we purchased), employee commuting, business travel and emissions from properties outside of our owned and managed operating properties and development portfolio. 2. We have purchased RECs to account for our purchased electricity since 2019. For 2019-2021, we include emissions from offices included in the Duke acquisition, per GHG Protocol requirements. For 2022 and 2023, our Scope 2 emissions were 7 and 17 metric tons of CO2e, respectively. 3. Total does not add up to 100% due to rounding. Excludes upstream leased assets at 0.001%. 23
 2023-24 ESG Report Page 22 Page 24